![]()
![]()
![]()
![]()
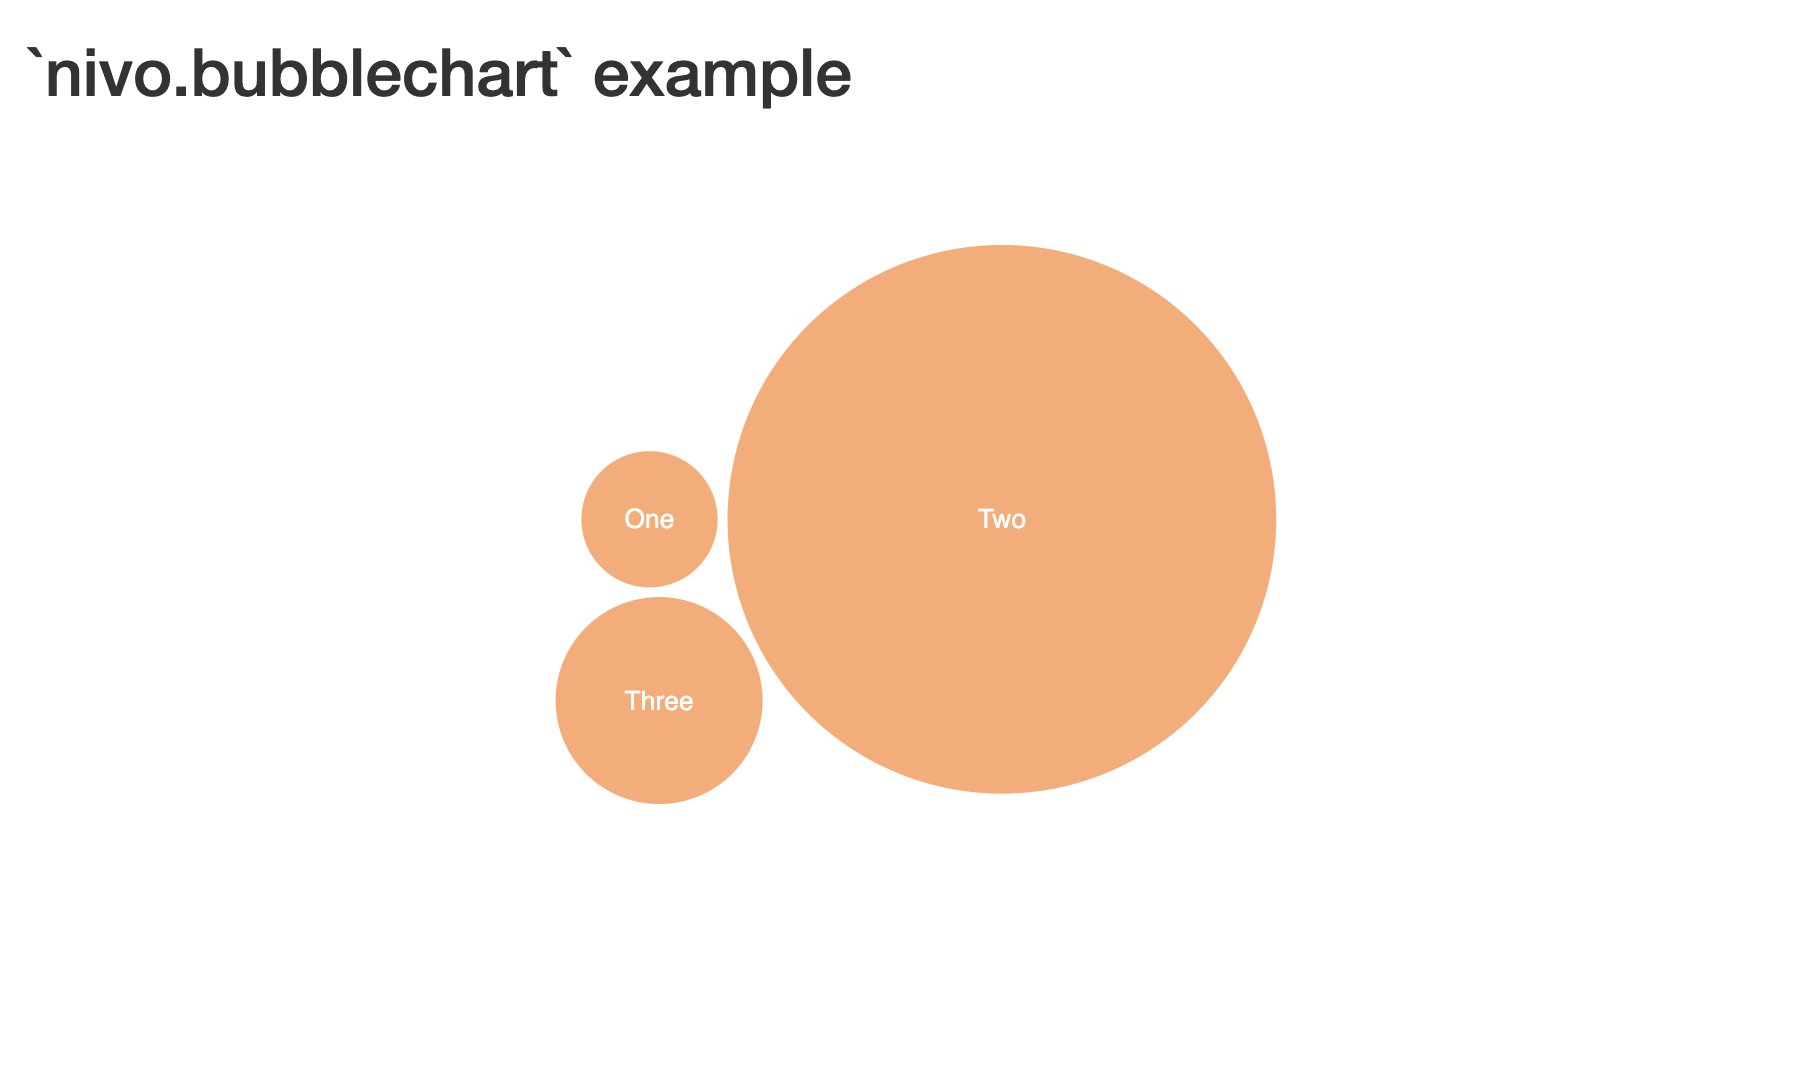
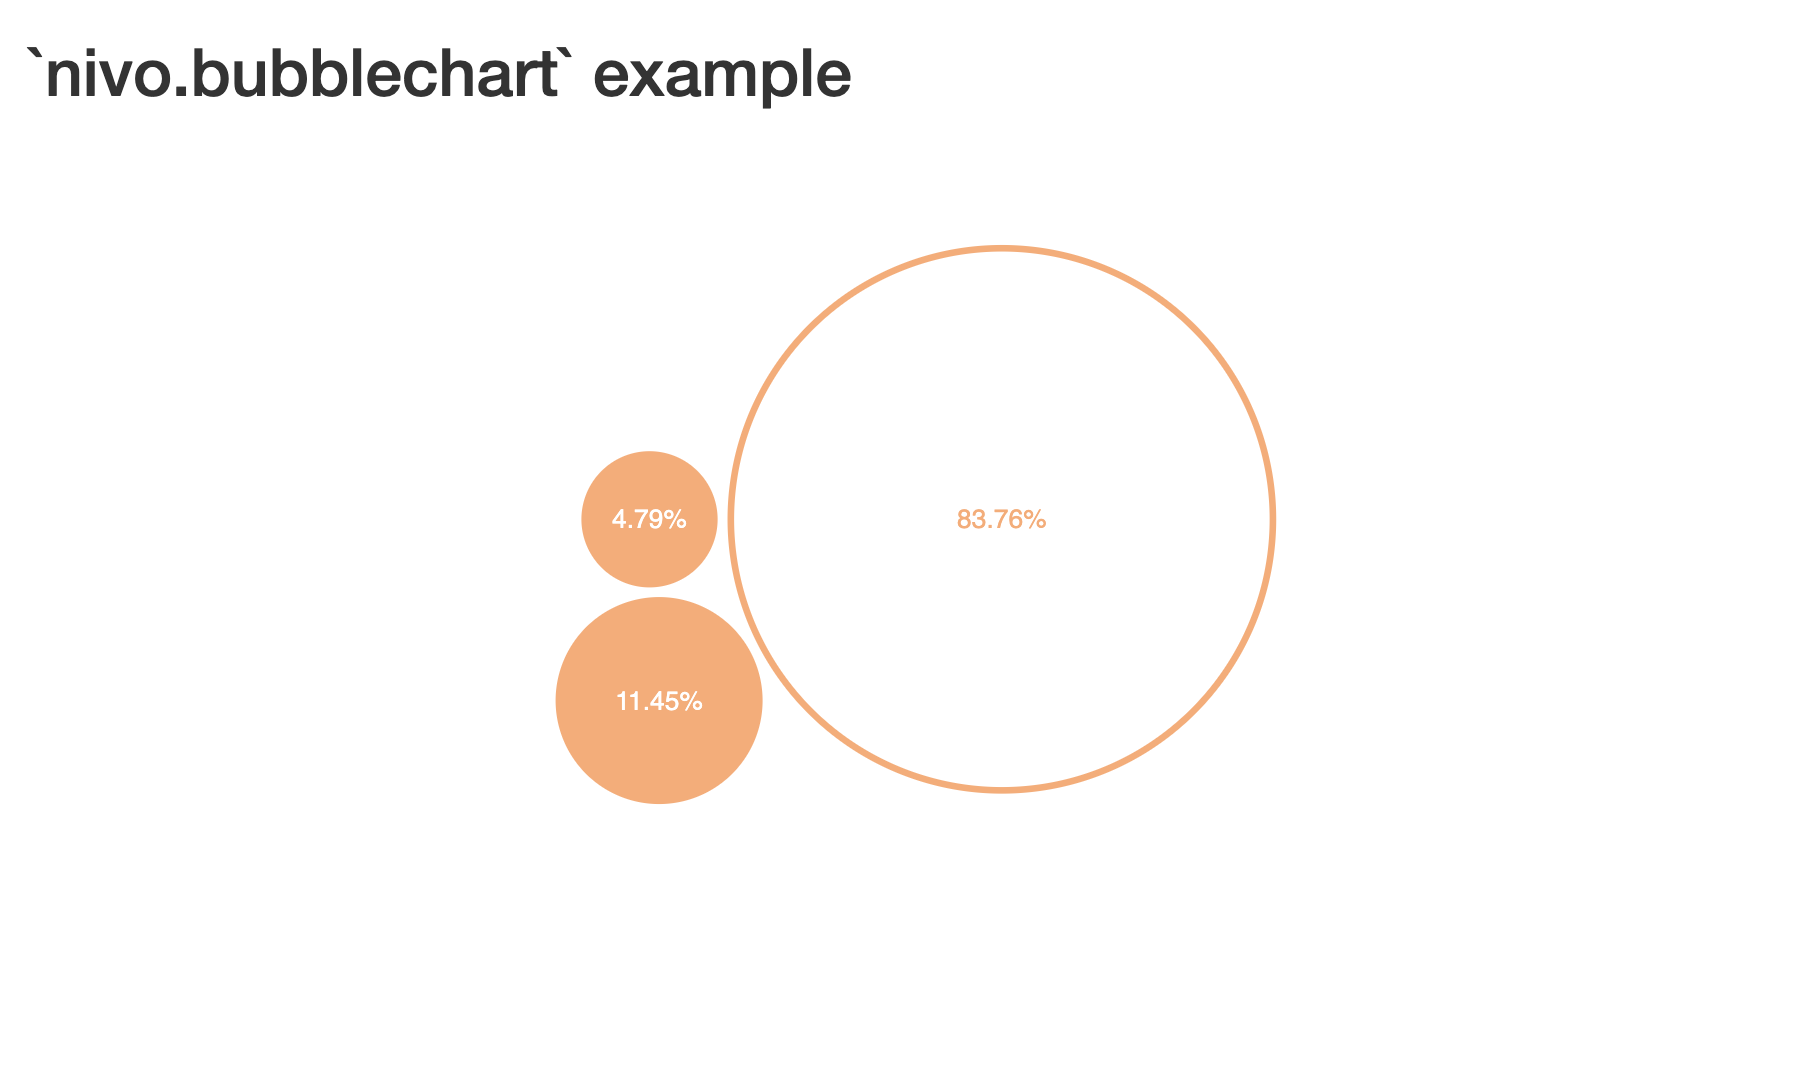
Interactive bubble charts for R and Shiny using Nivo
nivo.bubblechart brings circle packing visualizations from the Nivo library to R, making it easy to create interactive bubble charts for both static documents and Shiny applications.
prepare_bubble_data()install.packages("nivo.bubblechart")# Using pak
pak::pak("DataRacerEdu/nivo.bubblechart")
# Using remotes
remotes::install_github("DataRacerEdu/nivo.bubblechart")
# Using devtools
devtools::install_github("DataRacerEdu/nivo.bubblechart")library(nivo.bubblechart)
# Prepare data
sample_data <- list(
name = "root",
children = list(
list(name = "Apples", value = 450, color = "#ff6b6b", labelColor = "#ffffff"),
list(name = "Bananas", value = 320, color = "#feca57", labelColor = "#000000"),
list(name = "Oranges", value = 280, color = "#ff9f43", labelColor = "#ffffff"),
list(name = "Grapes", value = 150, color = "#a29bfe", labelColor = "#ffffff")
)
)
# Create visualization
bubblechart(
element_id = "fruit_chart",
main_color = "#ff6b6b",
label_color = "#ffffff",
on_hover_title_color = "#2c3e50",
data = sample_data,
height = "500px"
)Most users work with data frames. Use
prepare_bubble_data() to convert:
df <- data.frame(
  product = c("Laptop", "Phone", "Tablet", "Watch"),
  sales = c(45000, 38000, 22000, 15000),
  category_color = c("#3498db", "#e74c3c", "#f39c12", "#9b59b6"),
  text_color = rep("#ffffff", 4)
)

chart_data <- prepare_bubble_data(
  df,
  name_col = "product",
  value_col = "sales",
  color_col = "category_color",
  label_color_col = "text_color"
)

bubblechart(
  element_id = "sales_chart",
  main_color = "#3498db",
  label_color = "#ffffff",
  on_hover_title_color = "#2c3e50",
  data = chart_data,
  height = "600px"
)library(shiny)
library(nivo.bubblechart)
ui <- fluidPage(
titlePanel("Interactive Bubble Chart"),
sidebarLayout(
sidebarPanel(
h4("Click Statistics"),
verbatimTextOutput("click_info")
),
mainPanel(
bubblechartOutput("chart", height = "600px")
)
)
)
server <- function(input, output, session) {
chart_data <- list(
name = "Companies",
children = list(
list(name = "Tech", value = 2800, color = "#3498db", labelColor = "#ffffff"),
list(name = "Finance", value = 2100, color = "#2ecc71", labelColor = "#ffffff"),
list(name = "Retail", value = 1500, color = "#e74c3c", labelColor = "#ffffff")
)
)
output$chart <- renderBubblechart({
bubblechart(
element_id = "company_viz",
main_color = "#3498db",
label_color = "#ffffff",
on_hover_title_color = "#f39c12",
data = chart_data,
height = "600px"
)
})
output$click_info <- renderPrint({
clicked <- input$company_viz_clicked
if (is.null(clicked)) {
cat("Click on a bubble to see details")
} else if (clicked == "DESELECT_EVENT") {
cat("Bubble deselected")
} else {
cat("Selected:", clicked)
}
})
}
shinyApp(ui, server)bubblechart(
element_id = "custom_chart",
main_color = "#2c3e50", # Base color
label_color = "#ecf0f1", # Label text color
activeColor = "#e74c3c", # Selected bubble color
on_hover_title_color = "#f39c12", # Hover color
borderWidth = 5, # Border thickness
isInteractive = TRUE, # Enable interactions
data = your_data,
height = "600px",
width = "100%"
)
Portfolio Analysis - Visualize asset allocation with bubble size representing investment amounts and colors indicating risk levels.
Web Analytics - Display page performance metrics with bubble size for traffic and colors for conversion rates.
Survey Results - Show categorical responses with bubble sizes representing vote counts.
Market Analysis - Represent market share distribution with customizable colors for different sectors.
vignette("introduction", package = "nivo.bubblechart")?bubblechart and
?prepare_bubble_data| Function | Description |
|---|---|
bubblechart() |
Create an interactive bubble chart |
prepare_bubble_data() |
Convert data frames to chart format |
bubblechartOutput() |
Shiny output function |
renderBubblechart() |
Shiny render function |
Contributions welcome. Please open an issue first for major changes.
# Clone the repository
git clone https://github.com/DataRacerEdu/nivo.bubblechart.git

# Install dependencies
pak::pak(".")

# Run tests
devtools::test()

# Check package
devtools::check()MIT License.
vignette("introduction", package = "nivo.bubblechart")Made by Anastasiia Kostiv | DataRacerEdu
